🚨 I’ll be live at noon ET🚨
The difference between traditional and volume-based indicators, why traditional indicators based on math formulas are largely ineffective, VWAP and AVWAP and how we can use each to help gauge trades and more [tap to join us for the VIP Trade Room]!
One of the biggest challenges traders face is distinguishing between meaningful price moves and random market noise. You don’t want to chase every wiggle on the chart, but you also don’t want to miss the real deal when conviction enters the market.
Here’s the good news…
You don’t need the latest, greatest gadget to figure this out. You just need your eyeballs and a simple framework I use every day.
Compare today’s bar size to the previous five to 10 trading days. That’s it. If the bars are roughly the same size, the market is likely moving randomly. If today’s bar is one and a half to two times larger with higher volume, it’s a non-random move — and that’s when you should pay attention.
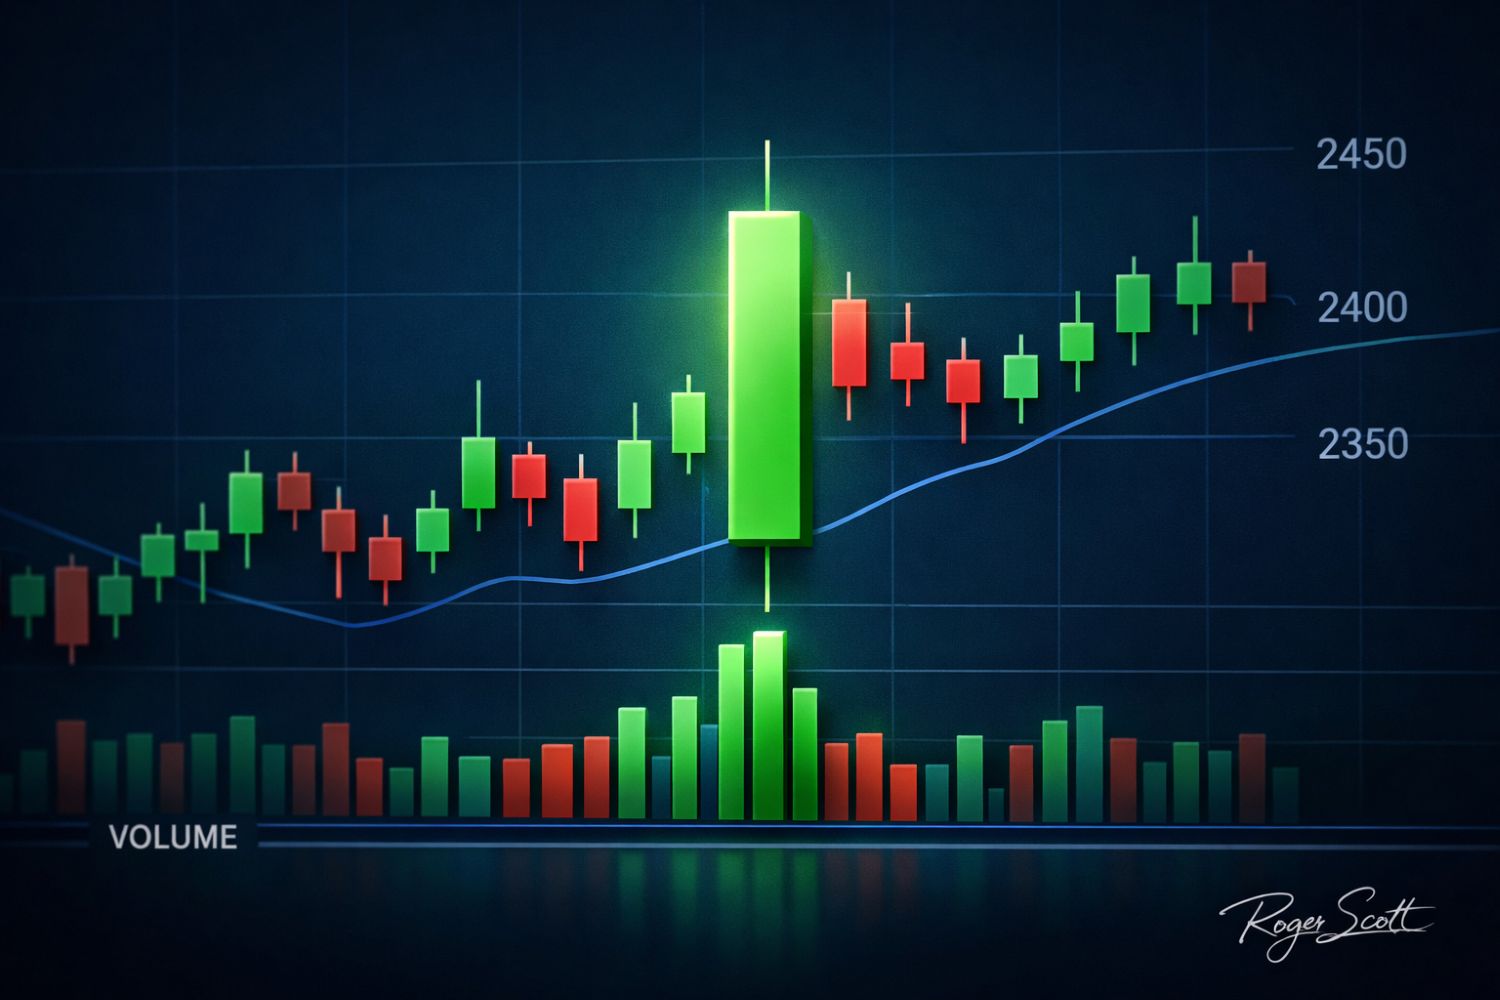
This becomes especially important when you’re trading in the direction of the main trend. When the market pulls back, you want that pullback to be random. If it’s not, that pullback can sustain itself and turn into something much bigger, which means you could be stepping in at exactly the wrong time.
Why Random vs Non-Random Price Action Matters
When you’re looking to buy a dip in an uptrend, you want the dip to look weak and choppy. If the bars during the pullback are all roughly the same size as the days before, that’s random price action — the market is just drifting without conviction. That’s what you want to see before entering in the direction of the trend.
But if the pullback suddenly shows a bar that’s one and a half to two times larger than the preceding days, especially with volume above average, that’s non-random. That means the move has conviction behind it and can easily keep going.
You don’t want to trade against that kind of momentum.
This is why volume matters so much. If bar size expands and volume expands with it, you’re getting confirmation that the market isn’t just drifting. It’s acting with purpose. If the bar is oversized but volume doesn’t support it, the move may lack real follow-through.
A Live Example: Crude Oil’s Recent Move
I was watching crude oil as it bounced around its 200-day moving average. For several sessions, the price action looked random — bars were all about the same size with no real conviction.
Then everything changed. The next bar was significantly larger than the previous days, volume surged and price moved above the 200-day moving average. That combination — larger bar, higher volume, decisive break — signaled non-random action.
Even more important, the bar had very little wick. It was a full bar with strong follow-through, which tells you the market wasn’t just testing levels. It was moving with intent. When you see a large bar with almost no wick and elevated volume, that’s conviction at work.
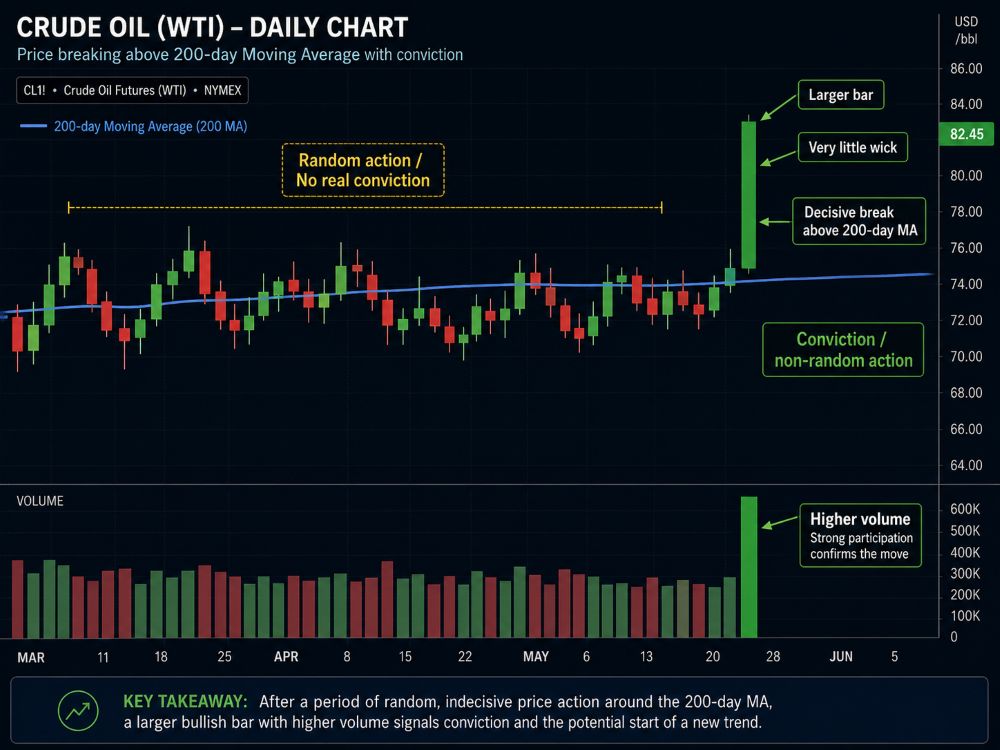
These visual cues give you a systematic way to judge whether a move is likely to continue or fade back into consolidation. They help you avoid stepping into a trend too early or too late, and help you identify when the market is actually ready to run.
Write this down or save this article link and use it. It’s one of the most valuable tools you can keep in your trading arsenal.
I hope that helps!
Roger Scott
Roger Scott Trading
Follow along and join the conversation for real-time analysis, trade ideas, market insights and more!
- Telegram:https://t.me/+_vmfwkeP8fA5YWQ5
- YouTube:https://www.youtube.com/@Roger-Scott/videos
- Instagram:https://www.instagram.com/thetradingpub/
- Facebook:https://www.facebook.com/TheTradingPubOfficial
- Twitter: https://twitter.com/Rogerscott1970
Important Note: No one from The TradingPub team or Roger Scott Trading will ever message you directly on Telegram.