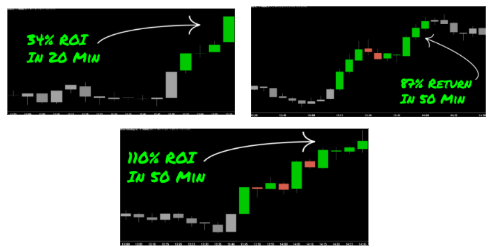
🚨 I’ll be live at noon ET🚨
The two most important parts of fast day trades, volume, momentum, options selection live Sniper setups, my top stocks for day and swing trades, daily market analysis and more [tap to join us for the VIP Trade Room]!
Every trader has experienced it…
You enter a position, the setup looks clean and momentum is building — then the stock stops. It grinds sideways, fakes out and goes nowhere. Most traders blame bad luck or timing. But here’s what’s really happening…
You walked into a liquidity pocket, and the bag holders were waiting for you so they could unload.
Price tends to get stuck in liquidity pockets. That’s not an opinion — it’s a pattern I’ve watched play out across countless stocks over many decades. Once you understand it, you can identify invisible resistance and plan your trades accordingly.
What a Liquidity Pocket Actually Is
A liquidity pocket forms where significant consolidation occurred in the past. In human terms, it represents a crowd of traders who bought within a certain price range and are now sitting at a loss.
They’re not gone — they’re waiting.
Imagine you’re going long and price is approaching one of these zones. Right above your entry is a group of bag holders who have spent weeks or months waiting to get their money back.
As the stock rallies into their purchase range, they start selling. Your buying pressure runs directly into their exit orders, creating resistance that may stall or reverse the move.
To identify these pockets, I go back one year on the chart. Looking back two or three years often adds noise because valuations, market conditions and investor expectations can change substantially.
Traders who bought two years ago may no longer be relevant to the current setup. A one-year window usually gives me the clearest picture of the supply most likely to affect price now.
Map the major consolidation zones within that window. If a stock is moving downward and there’s nothing to the left — no consolidation or past price buildup — that can mean smooth sailing.
There are fewer bag holders to impede the move, creating greater conviction for a short trade. When a stock gets stuck in the mud on the way up but moves cleanly on the way down, the path of least resistance becomes clear.
Counting Pockets Before You Trade
Before entering a directional trade, count the liquidity pockets between the current price and your target. If you want to go long but several pockets sit overhead, traders may sell each time price reaches those levels.
That’s not a clean setup — it’s a grind that can quickly erode your edge.
I’m also looking for stocks that aren’t already overextended. Ideally, I want a move that has just started rather than one that has already traveled too far from its normal range. A clear path means less when the stock is stretched and vulnerable to a snap back.
If a stock gaps down far from its eight-day moving average, that’s day-trade mode only — and volume must validate the deviation. Liquidity pockets don’t override every other factor, but they help determine how aggressively I size a trade and how patient I need to be.
Pull up a stock on your watchlist, go back one year and ask yourself…
Is the path clear, or is it loaded with bag holders?
The answer may tell you more than most indicators ever will.
I hope that helps!
Roger Scott
Roger Scott Trading
Follow along and join the conversation for real-time analysis, trade ideas, market insights and more!
- Telegram:https://t.me/+_vmfwkeP8fA5YWQ5
- YouTube:https://www.youtube.com/@Roger-Scott/videos
- Instagram:https://www.instagram.com/thetradingpub/
- Facebook:https://www.facebook.com/TheTradingPubOfficial
- Twitter: https://twitter.com/Rogerscott1970
Important Note: No one from The TradingPub team or Roger Scott Trading will ever message you directly on Telegram.
P.S. Want FREE Access To My No. 1 Day Trading Tool?
The same tool that spots stocks Wall Street is likely buying at that very moment…