🚨 I’ll be live at noon ET🚨
We’ll analyze markets, give my top stocks and do an earnings update, dive into scalps, day trades, short-term swings, non-directionals and when to initiate each type [tap to join us for the VIP Trade Room]!
There’s a progression I follow every single trading day that most never consider — and it’s one of the biggest reasons they struggle with timing and execution.
It’s not just about which chart you’re viewing. It’s about when you’re viewing it and how much weight you give it at different points in the session.
The less time left in the trading day, the more I focus on the daily chart. Early in the session, I’m locked in on 5-minute action. By 2 or 3 p.m. ET, I’ve shifted my attention almost entirely to the daily chart for swing setups.
3 Time Frames, 3 Different Jobs
I typically use three time frames together: the 5-minute, 1-hour and daily charts. Each one answers a different question.
The daily chart shows the broader trend, key levels and overall structure. The 1-hour chart helps me judge whether momentum is building or fading. The 5-minute chart gives me the precision needed to time an entry and manage immediate risk.
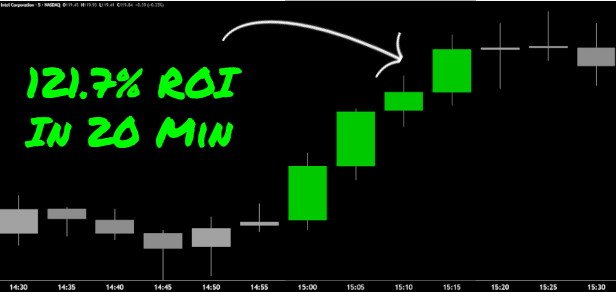
During market hours until about 2 or 3 p.m. ET, I focus heavily on the 5-minute chart. These are usually scalp trades lasting 15 to 20 minutes. At this stage, the current 5-minute volume matters more than total daily volume because I need to know whether the stock is moving now with enough participation to support a quick entry and exit.
I still check the daily chart before entering. If the broader structure is poor or the stock is pushing directly into major resistance, a clean 5-minute setup may not be worth taking.
The goal is synchronization…
Use the daily chart for direction, the hourly chart for confirmation and the 5-minute chart for execution.
The Afternoon Shift: Volume, ATR and Swing Setups
At 2 or 3 p.m. ET, I start focusing on the 1-hour scanner while continuing to monitor the 5-minute chart. I’m hunting for stocks moving aggressively and closing near the top of their range.
If I’m considering turning a trade into a swing position, overall daily volume becomes much more important. By the end of the session, roughly 80% of my attention is on the daily chart. I still use the 5-minute chart to see how smoothly the trend is moving, but the daily chart drives the decision.
I also check Average True Range (ATR) to understand how much the stock typically moves in a day. If a stock has a daily ATR of about $1.99 and has already climbed nearly $2 that day, I know much of its typical range may be exhausted.
That doesn’t guarantee a reversal, but it can affect whether I chase the move, tighten my stop or wait for a pullback.
ATR also helps set realistic expectations. Entering near the bottom of the daily range may leave room for a larger target. Entering after most of the average range has been covered may call for a smaller target and more conservative risk management.
This time-based weighting system keeps me aligned with the right setups at the right times. It isn’t rigid, but it is intentional — and it’s one of the most practical frameworks I use every trading day.
I hope that helps!
Roger Scott
Roger Scott Trading
Follow along and join the conversation for real-time analysis, trade ideas, market insights and more!
- Telegram:https://t.me/+_vmfwkeP8fA5YWQ5
- YouTube:https://www.youtube.com/@Roger-Scott/videos
- Instagram:https://www.instagram.com/thetradingpub/
- Facebook:https://www.facebook.com/TheTradingPubOfficial
- Twitter: https://twitter.com/Rogerscott1970
Important Note: No one from The TradingPub team or Roger Scott Trading will ever message you directly on Telegram.
There’s a brand-new secret that helps us spot stocks that Wall Street’s buying at that very moment…
Giving us shots at double- and even triple-digit returns in minutes!