I’m going to get a haircut right now. My current “do” is completely embarrassing. I wouldn’t be upset if my family stopped talking to me given my current hair configuration.
So, I’ll be keeping this brief… but targeted.
It’s time for a Monday Chart Party. Here are my 5 key charts for May 2023…
Chart 1: Party like it’s 2021
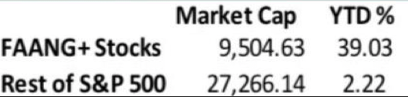
After Friday’s surge from Apple (AAPL) stock, the S&P 500 is back in FAANG mode. FAANG stocks (Meta, Apple, NVIDIA, Amazon, Alphabet, etc.) are now up 39% on the year. But the rest of the S&P 500 is up just 2.2%. This was the story of 2021.
Chart 2: Trade the Fed… Fade the Fed

This great chart from Bespoke shows the pattern of the S&P 500 after Jerome Powell speaks after FOMC meetings dating back to 2018. The SPX likes to dump, pop, and then sell off over the last 90 minutes. As I’ve noted, the market runs between 2:35pm and 2:37pm… then it dives right after 3pm. This trend happened again on Wednesday.
Chart 3: Europe Continues to Awaken From Crisis

While everyone focuses on U.S. banks and liquidity here, October was the global liquidity market bottom that’s barely discussed. European stocks continue to climb out of levels we hadn’t seen since late 2020. Keep an eye on ECB policy. And remember that Buffett’s buying Japanese banks. Pivot coming from the BOJ?
Chart 4: The EU is Led By Economic Incompetents

I almost swallowed my tongue when an Oxford Ph.D. used this chart to cheer Europe’s “energy transition” and the reduction in coal demand. The celebrated uptick in solar and wind supply is minuscule when compared to the demand “destruction” that has hit Europe in this inflationary period. Only a person blinded by ideology can look at the -94 reduction in demand for electricity generation and see anything promising in the near term for Europe’s economy. Germany’s manufacturing leaders are leaving for nations with access to cheap natural gas. And European business loan demand is at 2008-level lows.
Chart 5: I’m Smart Enough to Know This Isn’t Good
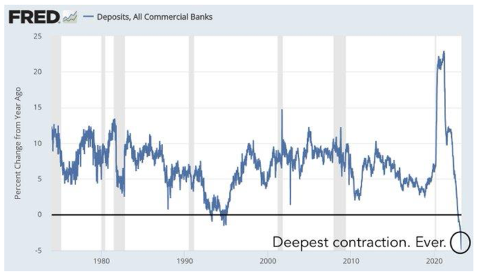
The deposit levels at the banks haven’t looked too good recently. Okay, they’re catastrophic. We’ve seen the deepest contraction on record. Just 55% of Americans believe that their money is safe right now in the banks. In addition to the panic over FDIC insurance levels, the uptick in interest rates has made U.S. T-bills much better alternatives to CDs or checking interest rates. Good thing the Fed did all that hard work stress-testing ahead of rate hikes. What a well-oiled machine.
There’s only one way to navigate this market: STOP TRADING.
Focus on the long-term and own stocks that have massive upside thanks to their current fundamentals. If you want to dive in right now, sign up for Tactical Wealth Investor today.
To your wealth,

Garrett Baldwin
*This is for informational and educational purposes only. There is an inherent risk in trading, so trade at your own risk.
Market Momentum is Red
Momentum has turned red this afternoon, but the market isn’t really “selling off.” There is a brief hold while market makers profit from the ongoing Buy the Dip trend. There is a lot of chop to this market, but remember, the purpose of the market is to sell – and institutions are selling right now.