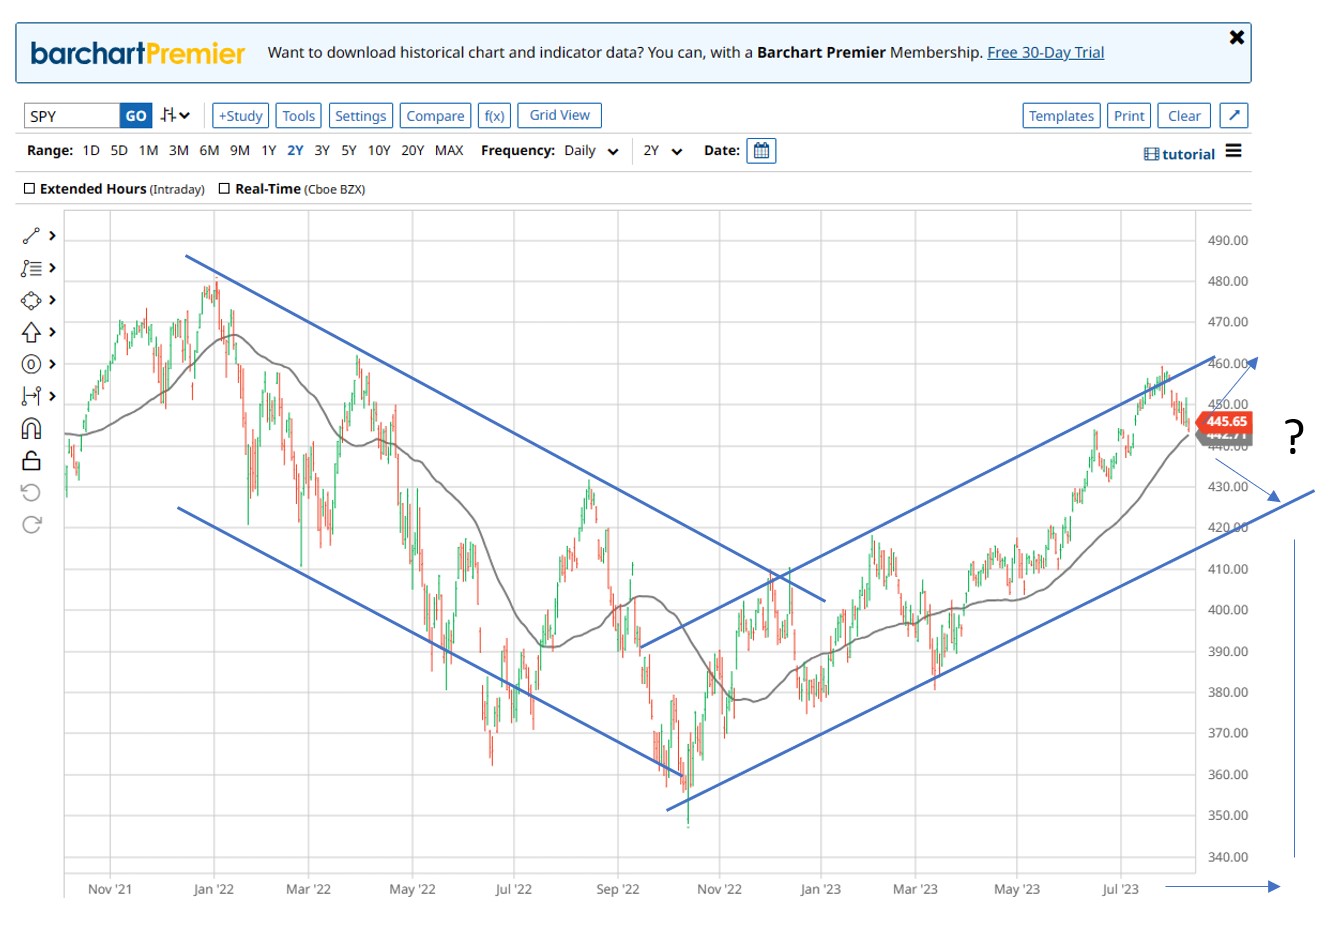
This week might have upside potential as the broad S&P 500 market bounces around its 50-day moving average (shown in the chart below).
The uptrend will be cut short if the seasonal patterns hold true. Additionally, a break below the 50-day technical indicator will put the broad S&P 500 market to the test of the trend line and its 200-day MA.
While traders will cringe at the pullback, this price action is normal. Just look at the past history.
Use the insights to trade with nimble fingers!
Think and Win!
Celeste Lindman
Celeste Lindman Trading
P.S. How to Avoid Fake Sell-Offs
Take a look at the vertical lines on this chart:
Those lines come from the proprietary indicator that my team and I developed…
To protect YOU from the B.S.
It can show you where to enter and trade…
So you can position yourself with:
- Less emotion.
- NO noise from the news.
- NO complicated patterns.
- NO guesswork.
- And absolutely NO B.S.!
Please join me at 1 p.m. ET on Tuesday, Aug. 15, as I reveal this powerful indicator LIVE!
This training is absolutely free to attend…