At the beginning of every month, I project price action in order to give me an edge in trading.
In fact, I call it my “Hard Right Edge.”
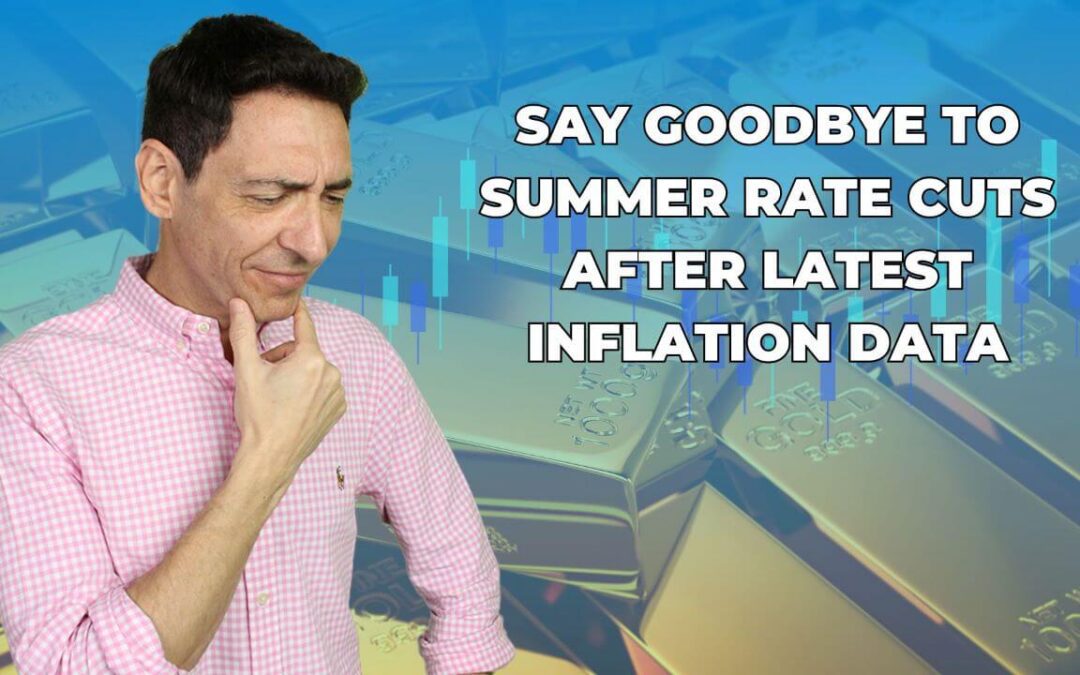
Here’s my projection for August using the Invesco S&P 500 Equal-Weight ETF (NYSEArca: RSP).
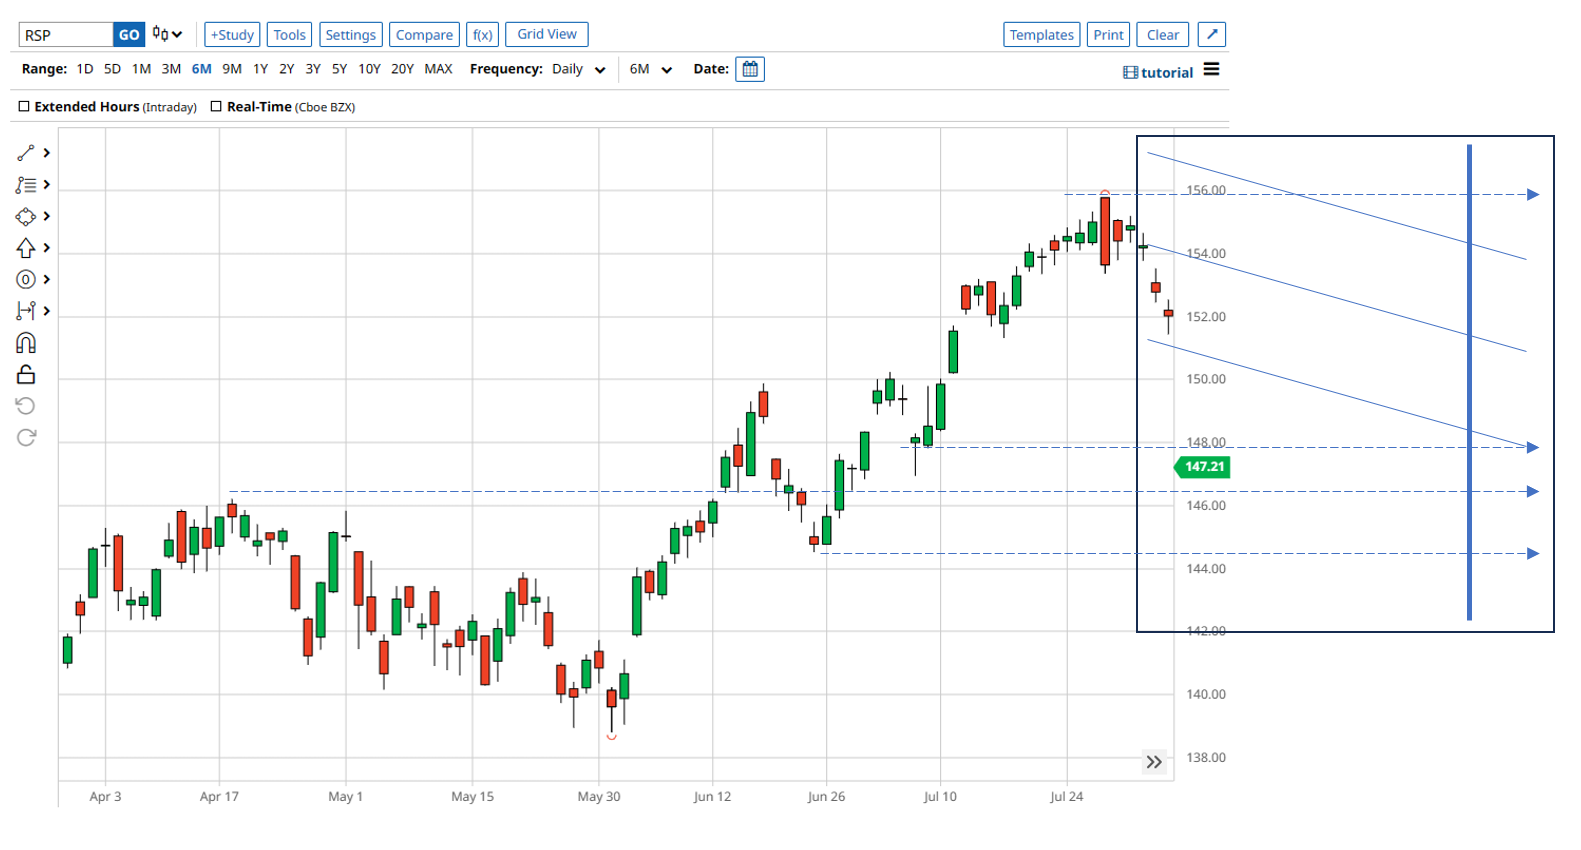
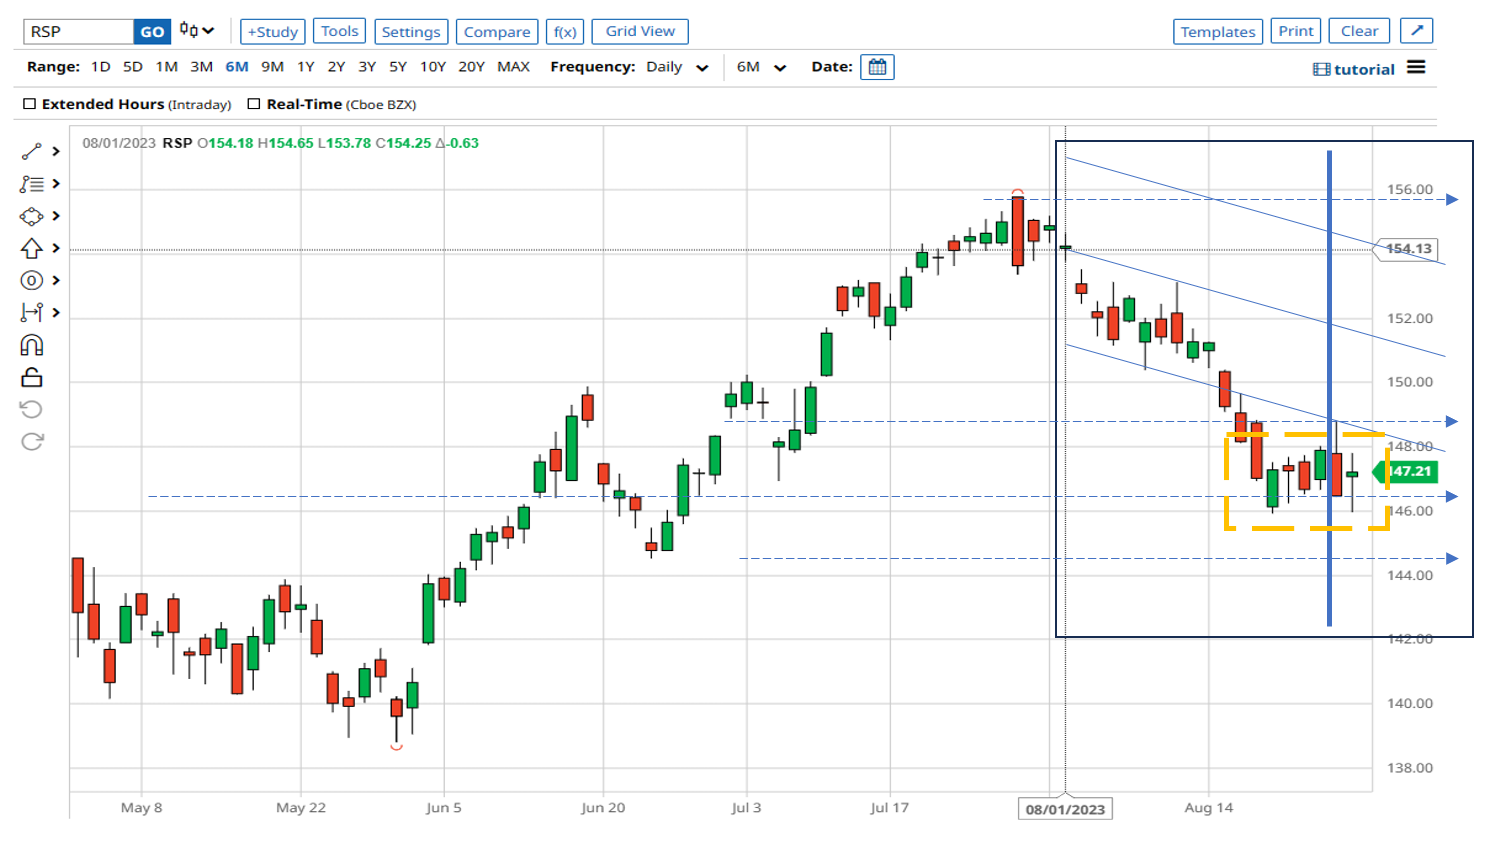
And this next chart is how RSP has played out so far with four days to go in August.
What has me concerned is the depth of the pullback below my projection. But I also see a light…
I’m going to talk about both at 4:05 p.m. ET on Thursday, Aug. 31, when I’ll also announce my September projection.
If you’d like to join the session — it will cost you less than a cup of coffee at Starbucks…
P.S. It’s Almost Time to Join Me LIVE!
At 1 p.m. ET TODAY, Aug. 28, Jack Carter is helping me expose Wall Street’s “dirty little secret” of tanking certain stocks each and every Monday… for the past 96 years!
We’ve opened the room early so you have time to get settled.
Click here now to join us live!
I recommend having something to take notes on because this will be an information-packed training session! Plus, I’m not sure it’ll be recorded.
This is something I like to call the “weekly turnaround.”
Tapping into this pattern has led to gains like 16%, 30% and even 69%, all in a matter of days!
And I’m pushing a new trade alert today!
Get the Details and My Next Trade Alert Here
From 11/28/22 to 08/11/23 on closed trade signals, the average win rate is 80.65%, and the average return per position (winners and losers) is 5.05% and a 31.50% average winner with an average hold time of 8.1 days on the options.