The long bond — the IShares 20-Plus Year Treasury Bond ETF (Nasdaq: TLT) — has made a lot of headlines the past few years.
More importantly, the overall note and bond market has made headlines with inverted yield curves, projections of a catastrophic future, and disagreements with the Federal Reserve revealed in price action.
There are a variety of just reasons for the headlines. Even a high school student could understand some of the situations behind the complex product’s struggles: interest rates, supply and demand, sovereign uncertainty, global turmoil…
Beyond that, TLT has found itself in oversold territory for a historically long stretch based on the 14-week RSI.
Long Term View – Buying Opportunity?
All that sounds alarming, but even more alarming is the long-term picture of TLT from its inception.

To some, this looks like a great buying opportunity.
I must admit, it looks like one to me as well. But let me explain…
For one, I don’t expect TLT to return to $180 anytime soon. That was the result of a historic move to zero interest rates that started as a result of the Great Recession. The Fed has been unwinding that.
Par Value
There is something about the word par that makes the move to $180 not only parabolic but unsustainable.
Par value is the face value of a bond. It’s the value used to determine fixed interest income.
Par value is commonly $1,000 or $100 depending on the instrument.
For purposes of TLT, the par value of the underlying is $100. If the coupon rate (rate of interest) is 5%, then regardless of the market value of the instrument, the holder gets paid $5 per year for 20 years.
The market value of a like bond could be $180 like TLT was in 2020, or it could be $85 like TLT is currently. It makes no difference. Based on the example above, the holder gets paid $5 per year on a 5%, 20-year $100 bond regardless of its market value.
Forgive me if I’m stating something obvious.
The point is that by its very nature, TLT returns to par around $100.
Time Frame Opportunities
Given that, is there anything tradable about TLT? In my opinion, absolutely, yes.
The key is to look at TLT using patterns, both long and short term.
One such a pattern is clear by observing what happens during oversold periods. Note the short-term move higher after oversold territories.

Source: Bespoke Premium
Next, looking back at the past three months of downturn, did TLT suffer because of current economic situations? Surely they are drastic and devastating… I’ll be the first to agree. But…
Check out the seasonality (blue line). Curious how it followed a pattern.

Source: Williams True Seasonal
Here’s another pattern… The TLT average forward returns after being in a significant time of oversold territory.
In 13 weeks from now, there’s a nice return (14 w RSI <=30) compared to the other time periods… But look out for 52 weeks.
Could a bear trap be setting up?

Source: Bespoke Premium
I don’t know… The seasonals look pretty strong for the next three months.
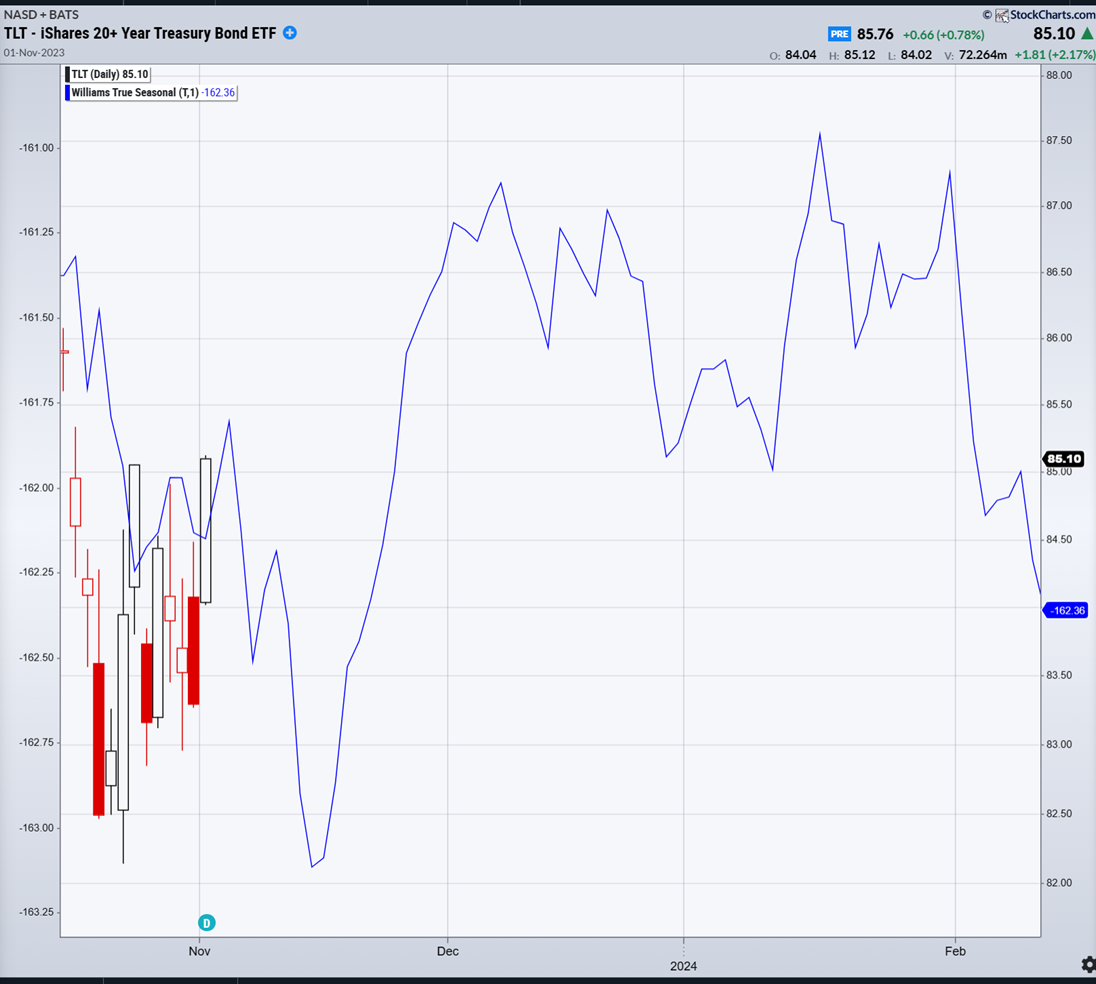
Source: Williams True Seasonal
But then again, they don’t look so hot for the first half of 2024.

Source: Williams True Seasonal
Use knowledge to make money — Think and Win!
Celeste Lindman
Celeste Lindman Trading
If you haven’t already, join my Telegram channel here for frequent trading insights and market musings!
*This is for informational and educational purposes only. There is an inherent risk in trading, so trade at your own risk.
P.S. Come ‘Steal’ Lance’s Plan for This Week’s BIG Earnings Trades
Options Strategist extraordinaire Lance Ippolito has gained quite the reputation for not only banking impressive 24-hour trades… but nailing earnings trades…
And for the first time, he’s inviting you to “steal” his plan for this week’s biggest earnings trades…
Currently, Lance has his eyes set on new opportunities like AAPL, DKNG, SQ and many more…
Now, he can never promise future returns, or against losses… But he intends to take a look at earnings setup this week…
So if you’d like to join him as he prepares…
Past performance is not indicative of any future results. Trade at your own risk. From 2/21/20 – 10/26/23 on live trades the win rate is 68.1%, the average return is 14.1% on the options over a 7 day average hold time, with an annualized return of 138.8%.