
Editor’s note: You may notice something new at the top of our articles on this site… social media sharing buttons! Feel free to share our actionable market insights and content with your family, friends and followers — the more, the merrier!
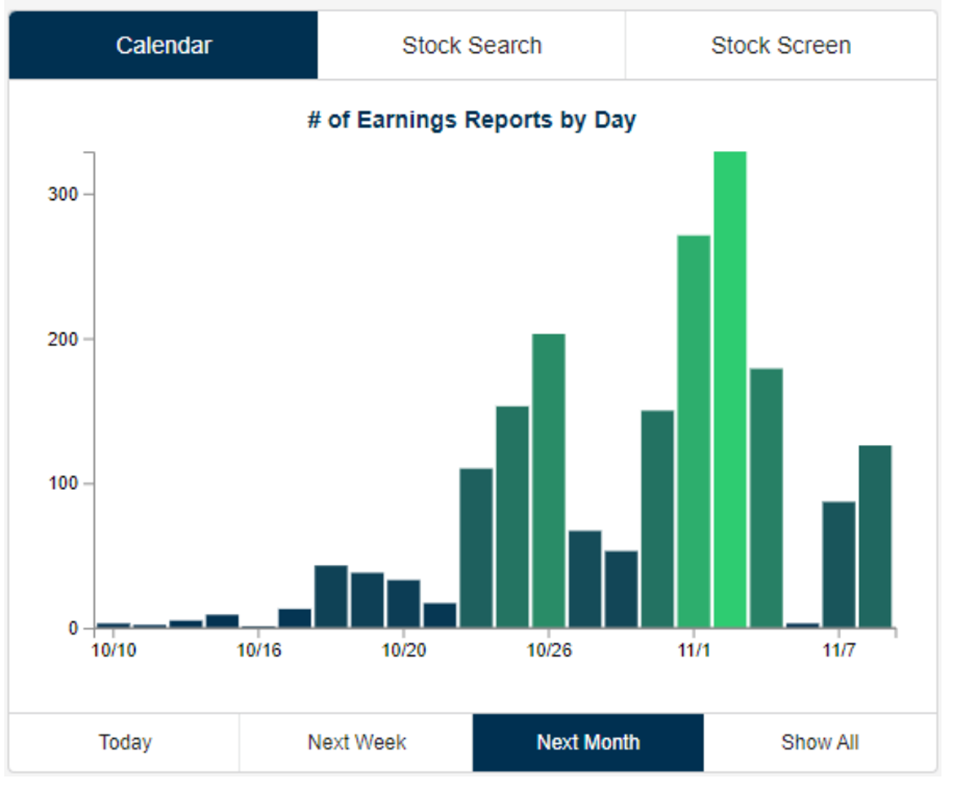
Earnings season is upon us as third-quarter results begin to make their way into headlines.
The pace of reporting picks up dramatically during the last week of October and the first week of November.
Source: BespokePremium
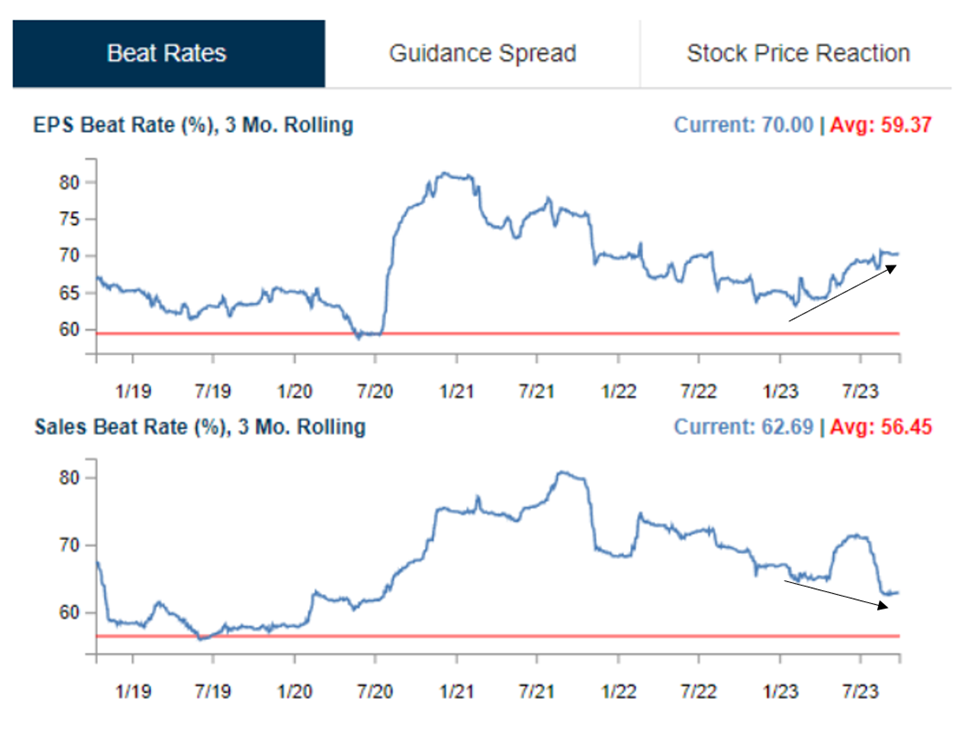
Heading into this season, 2023 EPS (earnings per share) Beat Rates are outpacing Sales Beat Rates by a good amount. This is a noteworthy shift, as you can see looking backward at the chart.
Source: BespokePremium
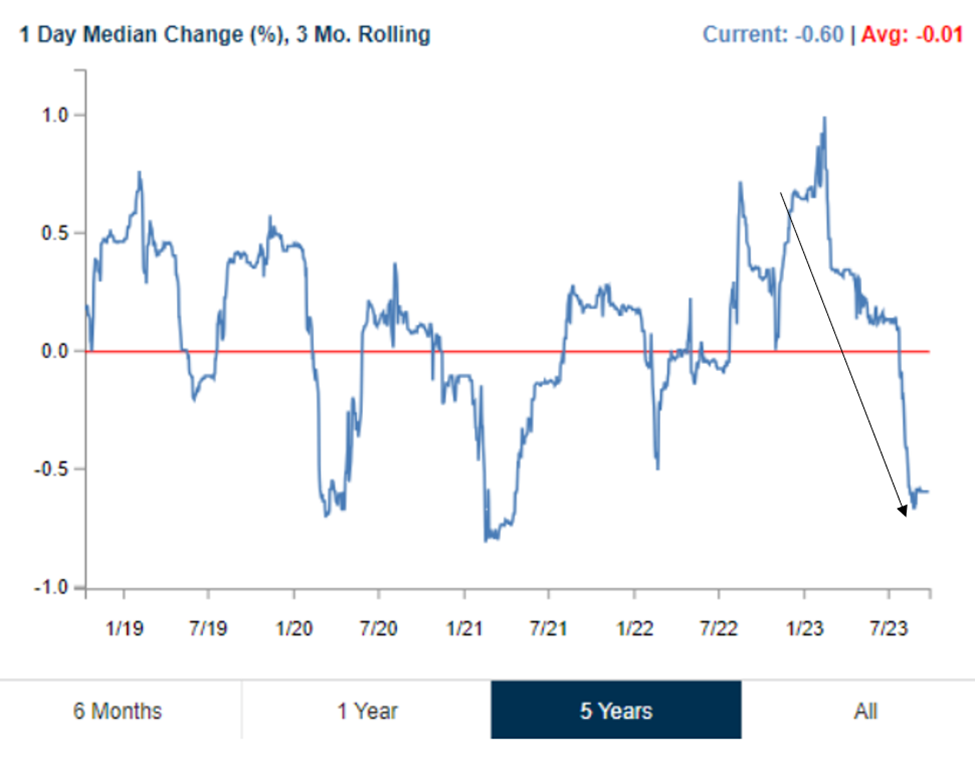
The average one-day stock price reaction on the day of earnings reports has been poor for 2023. Whether this average will continue remains to be seen, as does which sectors and stocks will be rewarded or punished.
Source: BespokePremium
Analysts lowered their Q3 guidance heading into earnings season. This pessimism is congruent with current Q4 sentiment, which is also negative. Given economic uncertainty and global tensions, this is not a surprise.
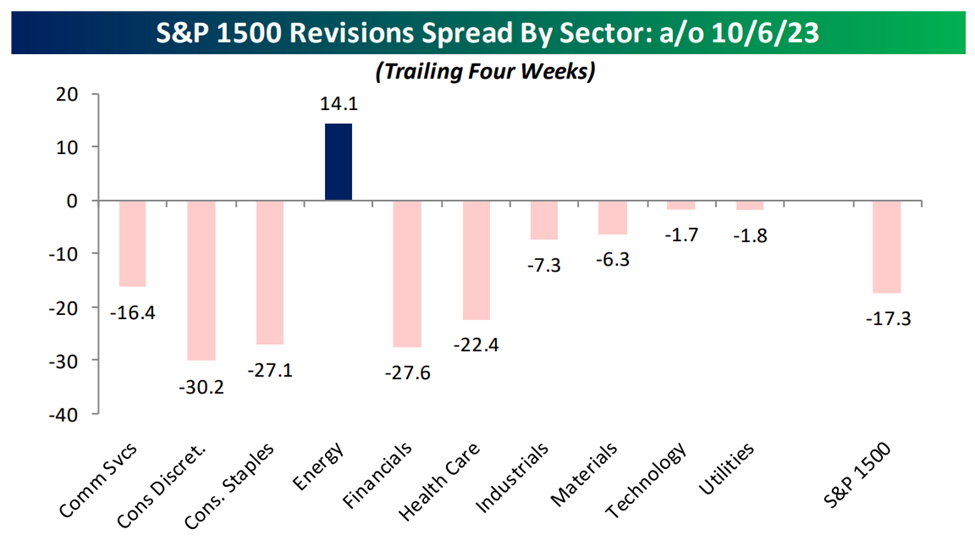
The recent spread between companies with upside analyst revisions compared to those with downside analyst revisions over the past month is shown below.
Every sector besides Energy has experienced revisions to the downside in terms of spread.
Source: BespokePremium
This will make seven quarters in a row that analysts have leaned bearish.
In four of the six prior periods, however, the market rallied. You read that correctly.
Of the two quarters that did not rally, they coincided with the Russia-Ukraine war and rampant inflation data.
Here’s what you need to know: Analysts’ EPS revisions leading up to reporting have been shown by BespokePremium to be a contrarian indicator during earnings season.
This contrarian market action in the sectors can be seen in the chart below, which is based on the number of downward revision occurrences. Based on the results, the jewels look to be Technology, Industrials and Materials.
Keep in mind that while Energy is on this list, it is expected to lag this quarter because the recent upward revision is also contrarian.

Source: BespokePremium
I hope this helps as you plan your days and weeks ahead.
Think and win!
Celeste Lindman
Celeste Lindman Trading
If you haven’t already, join my Telegram channel here for frequent trading insights and market musings!
*This is for informational and educational purposes only. There is an inherent risk in trading, so trade at your own risk.
P.S. You’d Never Know About This Unless You’ve Worked on Wall Street
There’s a dark force that controls the stock market.
Unless you’ve worked on Wall Street, you’d never know about it…
You might not even believe it.
Over my three decades of investing, I’ve been able to see it move stocks time and time again.
Unfortunately, up until now, for retail traders and regular folks, it’s been extremely difficult to access it and follow its patterns.
But today, that all changes.
For the first time ever, you’ll be able to see where this dark force could move a stock next…
Helping you get ahead of what could be some of the most significant moves in the stock market…
Before the Share Price Even Budges