🚨 I’ll be live at noon ET🚨
Most stocks we trade are heavily correlated to one index. If you can figure out which one, it can help you time your stock buys. We’ll discuss that, how NOT to use the VOLD indicator, the VIX, the TICK, the ADD and more [tap to join us for the VIP Trade Room]!
Most traders overcomplicate trend identification. They stack indicators on top of indicators, argue about moving average crossovers and spend way too much time trying to confirm what their eyes are already telling them.
Before applying any method, it helps to acknowledge the broader environment. When market internals are drifting sideways and conviction is low, you need a way to cut through the noise and identify stocks with real structural direction.
That’s where this approach shines.
It’s called the 20-degree slope rule, and once you understand it, you’ll never look at a chart the same way again.
The Setup: One Year, One Line
Every time a stock comes across your scanner, go back one year on your daily chart. That’s your baseline. From there, track the directional bias of the stock by drawing a line that follows the natural trajectory of price action.
You’re looking for the true path of travel — not every zigzag but the middle of the movement that reveals where the stock is genuinely heading.
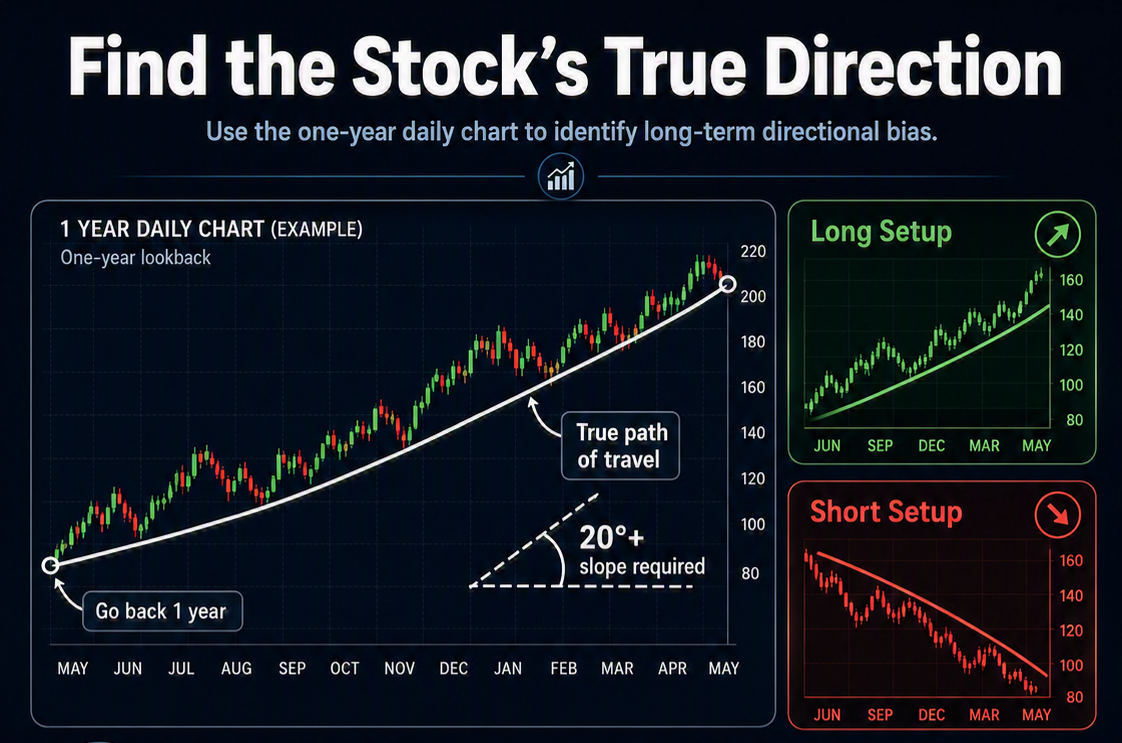
You want that price action to be at a slope of at least 20 degrees. If the slope doesn’t reach 20 degrees, the stock doesn’t have enough directional momentum to justify a trade.
This applies on both sides. For long setups, you want an upward slope. For short setups, you want a downward slope. Stocks tend to revert back to their long-term trend, and aligning with that structural bias puts you on the right side of probability.
But there’s an added nuance…
While the long-term slope determines the dominant path, short-term swings often rise and fall around that trajectory. The most attractive opportunities often appear where these shorter-term moves intersect with the long-term direction.
When the immediate price action snaps back toward a well-established trend, your risk drops and your edge increases. This interplay gives you the timing layer without needing additional indicators.
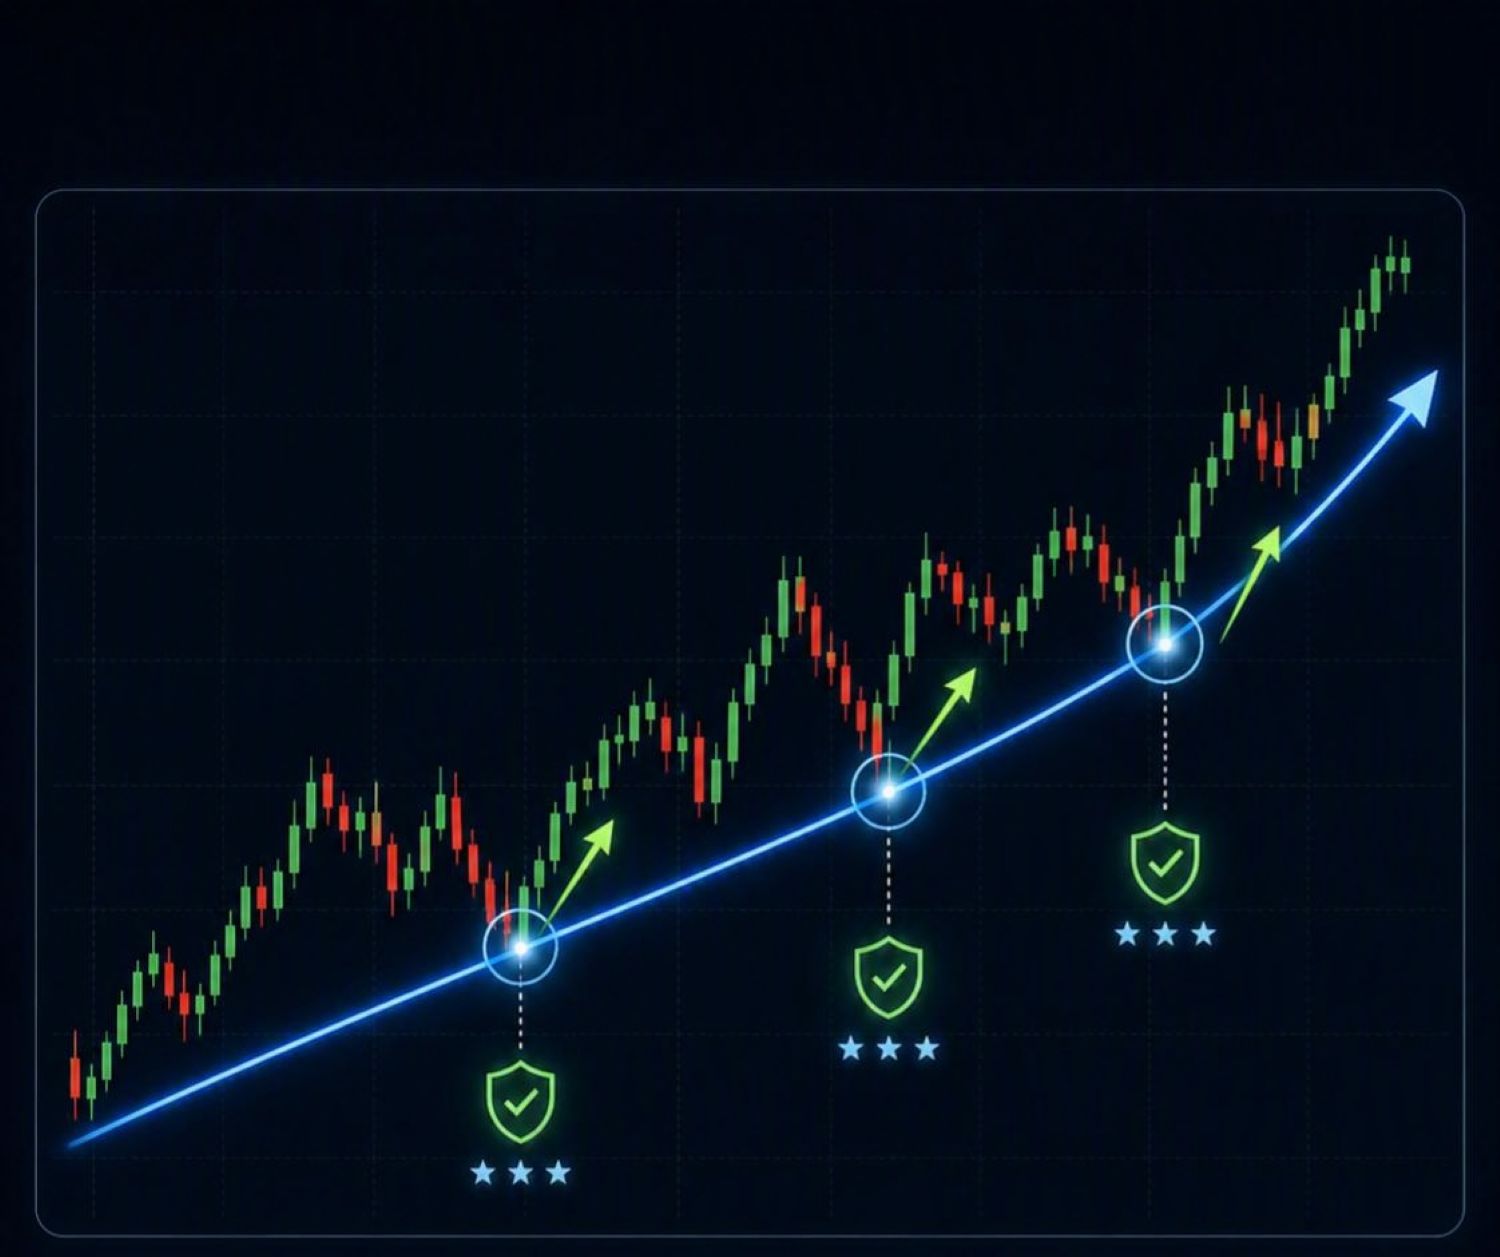
This all ties back to structure. The long-term trend is the backbone of the stock — the meat and potatoes. When you can clearly define that structure, it becomes much easier to build conviction around your trades. The 20-degree rule isn’t just about identifying a slope — it’s about confirming that the stock has real, enduring direction beneath the day-to-day movement.
Think Big Picture, Not Turn-by-Turn
Imagine you’re standing on a mountaintop looking at the terrain to decide whether you should be moving up or moving down. You’re not thinking about every small turn ahead — you’re asking one question: Are we going up or are we going down from here?
That’s the purpose of this exercise.
You don’t need to be a chart wizard to see it. Just identify the natural flow of price, draw your line and check the angle. If it clears 20 degrees, you’re working with structural trend quality. If it doesn’t, move on.
I hope that helps!
Roger Scott
Roger Scott Trading
Follow along and join the conversation for real-time analysis, trade ideas, market insights and more!
- Telegram:https://t.me/+_vmfwkeP8fA5YWQ5
- YouTube:https://www.youtube.com/@Roger-Scott/videos
- Instagram:https://www.instagram.com/thetradingpub/
- Facebook:https://www.facebook.com/TheTradingPubOfficial
- Twitter: https://twitter.com/Rogerscott1970
Important Note: No one from The TradingPub team or Roger Scott Trading will ever message you directly on Telegram.
LIVE ON CAMERA: My Biggest 0DTE Secret Revealed!
I recently went live to reveal how to turn micro-breakouts into shots with 50% or more returns in under an hour…
Thanks to a special zone that the market makers set in motion.