This week, oil prices peeled back to their lowest levels since March.
Despite OPEC’s cuts in early April and Goldman Sachs (GS) projections that oil would hit $95 very soon, the black commodity has been sinking fast.
The June 2023 futures contract sank from about $77 last Friday to nearly $66 this morning. Fund managers and retail traders are dumping energy stocks at a frantic pace.
They’ll later regret this.
As I’m about to show you, oil prices are bottoming out. I use a very simple chart to identify the opportunity to step back into the crude market – and this is one of those days.
Let me show you my secret weapon…
Triple Leverage and Leveraged Funds
I don’t follow Exxon Mobil (XOM) stock. I look at charts now and then on Occidental Petroleum (OXY) and Apache (APA). But neither can give me a clear understanding of large institutional volume in the oil markets.
That’s where the MicroSectors U.S. Big Oil Index 3X Leveraged ETNs (NRGU) comes in. This is basically the Matrix for the oil markets. It’s not an ETF…
NRGU aims to provide investors with returns that match triple-leveraged exposure to the underlying performance of the Solactive MicroSectors U.S. Big Oil Index.
The what?
Okay, the Solactive MicroSectors U.S. Big Oil Index is a tool that measures the total performance of the largest 10 oil and gas companies. They are:
- Exxon Mobil Corporation (XOM)
- Chevron Corporation (CVX)
- ConocoPhillips (COP)
- Schlumberger Limited (SLB)
- Pioneer Natural Resources Company (PXD)
- EOG Resources, Inc. (EOG)
- Phillips 66 (PSX)
- Occidental Petroleum Corporation (OXY)
- Valero Energy Corporation (VLO)
- Marathon Petroleum Corporation (MPC)
This gives me an ample view of the entire energy sector. And when the Solactive MicroSectors U.S. Big Oil Index goes up by 1%, the NRGU goes up by 3%.
And when the Index falls by 1%, the NRGU goes down by 3%.
Who’s trading this?
Well, it’s not something followed by most retail traders. It’s largely used as a hedging tool or a short-term trading tool for more sophisticated players.
It’s highly technical, which means that we want to look for clues on when a selloff may have concluded.
Oversold in Oil? Right on Time
Look at the Relative Strength Index (RSI) and the Money Flow Index (MFI). The two indices are down at oversold levels that we haven’t seen since July 2022, September 2022, and March 2023.
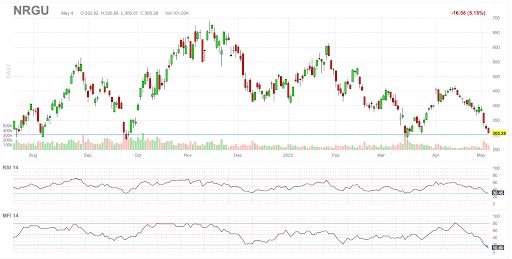
It suggests that there’s an opportunity to trade around some of our favorite names using put spreads on companies we’d LOVE to own at lower levels.
In fact, we have three positions in Tactical Wealth Investor that are back in oversold territory but are poised for big gains as the energy sector rebounds in the second half of the year on lower supply and increased Chinese demand.
I’ll be naming my new pick tomorrow in our monthly issue and breaking down all of the recent developments with the Fed, the banking crisis, oil prices, and OPEC’s supply cuts.
To your wealth,

Garrett Baldwin
*This is for informational and educational purposes only. There is an inherent risk in trading, so trade at your own risk.
Market Momentum is Red
Momentum is very red as the S&P 500 continues to drip lower. Apple (AAPL) has just reported earnings, and the market will now turn its attention to the jobs report on Friday morning. For a more complete breakdown of the macroeconomic picture, pick up a copy of my May Tactical Wealth Investor monthly newsletter, which digs deeper into the Fed’s rate hike and what investors can expect from an end to the debt ceiling fiasco.